作者: zhaorenhai
本篇文章尝试探索下,在arm64平台上都有哪些好用的性能监控工具,可以用来监控MariaDB数据库。
测试平台仍然选用华为云的鲲鹏虚拟机,OS采用Ubuntu18.04。 并提前已经在同内网内其他虚拟机上部署好了一对MariaDB主从数据库,并建好了供远程连接的数据库用户名和密码。MariaDB采用Ubuntu自带的10.1版本。
本文准备测试四个免费并且开源的工具,两个命令行工具,两个大型的图形化运维工具。
两个命令行工具是innotop和mytop
图形化运维工具就是Zabbix和Prometheus
innotop
innotop是一个用Perl写成的监控工具。源码在这里https://github.com/innotop/innotop 。
我们直接下载下最新代码。
1 | git clone https://github.com/innotop/innotop |
编译:
1 | cd innotop |
安装:
1 | sudo make install |
运行 (-w参数代表持久化模式,配置会持久化到文件里):
1 | innotop -w |
再输入一个?号,就可以看到使用指导。如下所示:
1 | Query List (? for help) Servers: server |
我们输入一个@,回车,来配置一个数据库,监控一下看看效果。
第一次输入之后,没有任何连接,可以先随便输入一个名字,命名一下新的连接,然后回车。
接下来按照提示输入数据库地址,端口,配置数据库地址和端口的格式如下:
1 | DBI:mysql:;host=192.168.0.204;port=3306 |
然后回车,会提示你用户名,密码等等,提示还是很友好的。
配置好以后,就可以正常使用了。
我们可以输入大写的A,B,Q,I等命令分别切换不同的界面看到数据库的缓存信息,IO信息,TPS等等。
为了能在同一个界面显示多个数据库,我们可以先输入@,配置一下多个数据库链接。
然后再输入一个#,创建一个服务器组,输入已建好的多个连接名字,用空格分隔,就可以了。
操作的时候我们选择服务器组,就可以在同一个界面显示多个服务器。
比如我们配置了一个master数据库,一个slave数据库,并将他们放置到了server组内。
下面是显示的这两个数据库的IO界面,效果还是很不错的:
1 |
|
本文不是innotop的介绍文档,仅仅是测试一下innotop是否能在arm64平台上正常运行,是否能正常监控MariaDB数据库。所以关于inntop的其他使用方法和界面介绍, 就不再啰嗦了。有兴趣的小伙伴也可以试一下,网上也有很多innotop的资料,用命令man innotop也可以看到使用指导。
mytop
mytop也是一个用Perl写的小工具,业界应用也比较广泛。不过缺点是只能连一个数据库服务器,而且比较老了,功能也比较简单,得到的信息比较有限。
mytop可以直接从apt命令安装:
1 | sudo apt install mytop |
配置,编辑如下文件:
1 | vi ~/.mytop |
输入如下内容:
1 | user=proxysql |
执行:
1 | mytop |
界面如下:
1 | MySQL on 192.168.0.204 (10.1.47) load 0.00 0.00 0.00 1/1397 32133 up 16+23:58:33 [17:45:26] |
可以看到风格和top差不多,效果也挺不错的。
关于mytop的更多信息,可以参考如下链接:http://jeremy.zawodny.com/mysql/mytop/ 。网上相关资料也很多,用man mytop命令也可看到相关指导。
Zabbix
Zabbix是一个大型的监控告警运维工具,不仅仅只是用来监控数据库的,不过我们这里只简单用它来监控一下MariaDB。
关于它的架构,功能等等的详细介绍,官网上包括其他网站上资料已经很多,这里不再详述。这里只描述在我们的测试环境上测试的步骤。(具体的安装步骤,不同版本的Zabbix可能不太一样,不同的OS也有不同,这里安装的是Ubuntu 18.04自带的Zabbix3.0版本,仅供参考)
首先我们在测试虚拟机上安装Zabbix Server和Zabbix Frontend
zabbix-server根据自身用的内置数据库的不同,有PostgreSql和Mysql两个版本,这里为了和我们要监控的目标数据库MariaDB区分开来,我们这里安装PostgreSql版本。
1 | sudo apt install zabbix-server-pgsql zabbix-frontend-php php-pgsql |
在我们要监控的主从数据库节点上都安装Zabbix Agent
1 | sudo apt install zabbix-agent |
Zabbix Agent安装之后就会自动启动。
Zabbix Server需要配置下,登陆Server所在节点
首先创建一个Zabbix Server自用的数据库
1 | sudo -u postgres createuser --pwprompt zabbix |
然后导入数据
1 | zcat /usr/share/zabbix-server-pgsql/schema.sql.gz |sudo -u zabbix psql zabbix |
在Zabbix Server配置文件中配置刚刚设置的自用数据库的相关信息
1 | vi /etc/zabbix/zabbix_server.conf |
确保如下配置项都配置正确
1 | DBHost=localhost |
启动Zabbix Server
1 | service zabbix-server start |
开始配置Frontend
1 | cd /etc/apache2/conf-enabled |
将里面的时区参数配置正确,默认的如下:
1 | # php_value date.timezone Europe/Riga |
我们改成如下设置:
1 | php_value date.timezone Asia/Shanghai |
修改成正确的时区后,继续做如下操作:
1 | service apache2 restart |
然后从浏览器访问如下链接(注意其中的地址要替换为你环境的地址,另外如果要从公网的地址访问的话,注意配置好华为云的安全组规则,限制要登陆的地址范围。)
http://测试机的ip地址/zabbix
然后点击next,根据提示一步步配置即可。
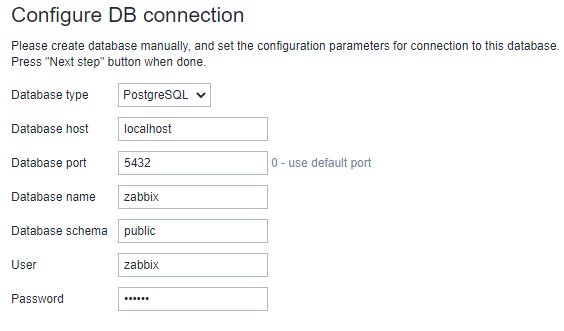
配置数据库连接的地方,按下图配置
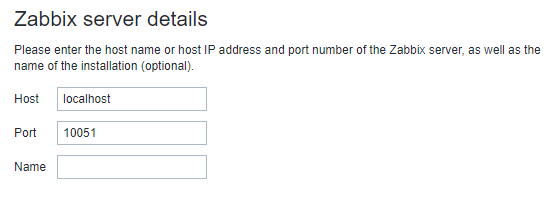
配置server的地方,直接默认值即可
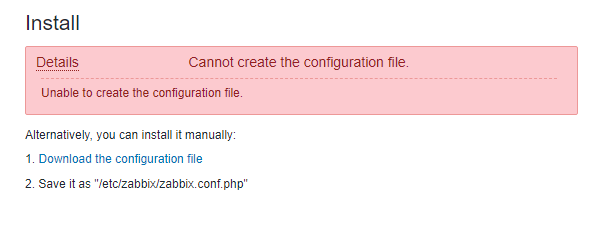
最后一步,会提示下载一个配置文件,将配置文件下载下来,上传到/etc/zabbix目录下即可。
最后重启下apache2
1 | service apache2 restart |
然后重新登陆 http://测试机的ip地址/zabbix 网页,输入用户名Admin,密码zabbix,就可以看到Zabbix的系统页面了。
然后我们创建两个Host,一个是MariaDB主库,一个是MariaDB从库。
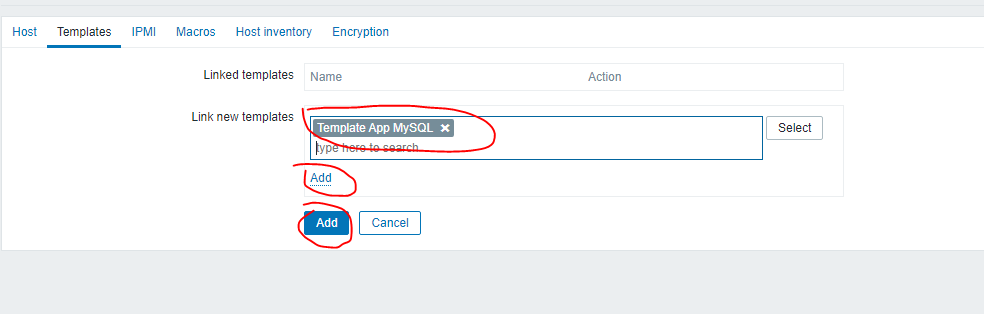
点击Configuration,Hosts,Create host,其中Host name,Groups和IP地址,是必填项。
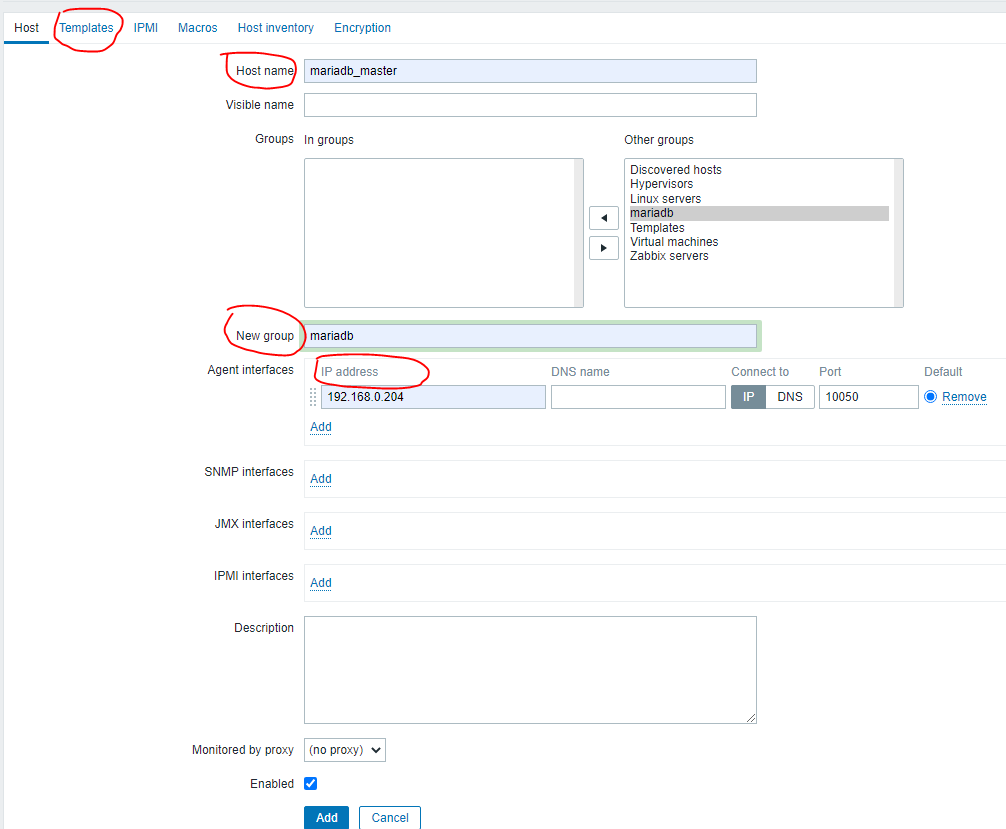
主机创建好后,可以点击上图中的圈红的那个Templates按钮,到如下页面,输入mysql搜索模板,然后点击add按钮,把mysql监控模板关联到主机
Frontend上面的配置就完成了。
登陆两个agent所在虚拟机,做如下配置
1 | cp /usr/share/doc/zabbix-agent/examples/userparameter_mysql.conf /etc/zabbix/zabbix_agentd.conf.d/ |
编辑配置文件
1 | vi /var/lib/zabbix/.my.cnf |
输入如下内容:
1 | [mysql] |
注意输入的用户要有在本机连接MariaDB,并有查询的相关权限。
然后编辑/etc/zabbix/zabbix_agentd.conf文件,确保如下三项的配置是正确的
1 | Server=192.168.0.54 |
其中Server和ServerActive是Zabbix Server的IP地址,Hostname是在Frontend上面配置的Agent所在的Host的名字,每个Agent的配置不一样。
然后重启agent
1 | service zabbix-agent restart |
现在重新登陆前端,就可以看到监控效果了。
点击Monitoring,Latest Data,可以看到很多监控项,带宽,慢查询,select,insert,delete请求的qps等等,都有。
我们看看一个带宽的监控图,效果如下:
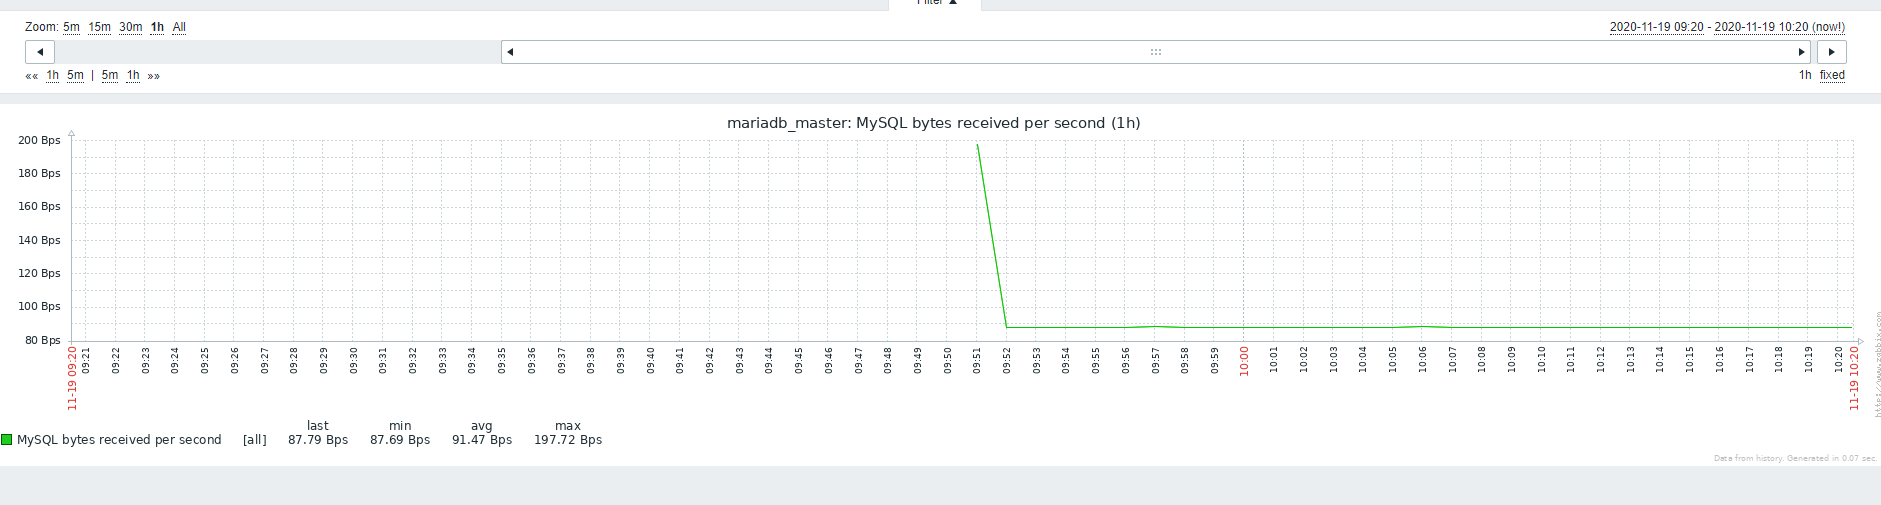
如果觉得默认的Mysql的模板功能不够完善,感兴趣的小伙伴可以自己定制模板,也可以从Percona的网站上面下载已经定制好的功能比较完善的模板,导入进来。 这里就不详细介绍了
Prometheus
Prometheus 也是一个大型的监控运维工具,这次我们也只是简单测试下他的数据库监控功能,关于他的架构,功能等各方面的介绍,这里就不再多说。
我们首先来安装一下Prometheus Server。
我们从官网下载一个最新的arm64版本的Prometheus来安装。
1 | wget https://github.com/prometheus/prometheus/releases/download/v2.22.2/prometheus-2.22.2.linux-arm64.tar.gz |
在主从数据库节点上下载最新的mysqld_exporter来安装
1 | wget https://github.com/prometheus/mysqld_exporter/releases/download/v0.12.1/mysqld_exporter-0.12.1.linux-arm64.tar.gz |
编辑文件vi prometheus.yml,追加如下配置,里面的IP地址是主从数据库节点的IP,端口是稍后我们会安装在主从数据库节点的相当于客户端进程的端口,我们这里先配置上。
1 | - job_name: 'mariadb' |
启动Prometheus
1 | ./prometheus --config.file=prometheus.yml |
在主从数据库节点上都编辑如下的文件
1 | vi .my.cnf |
输入如下内容,注意确保输入的用户有在本地连接MariaDB的权限,并有相关查询的权限:
1 | [client] |
启动mysqld_exporter
1 | nohup ./mysqld_exporter --config.my-cnf=./.my.cnf & |
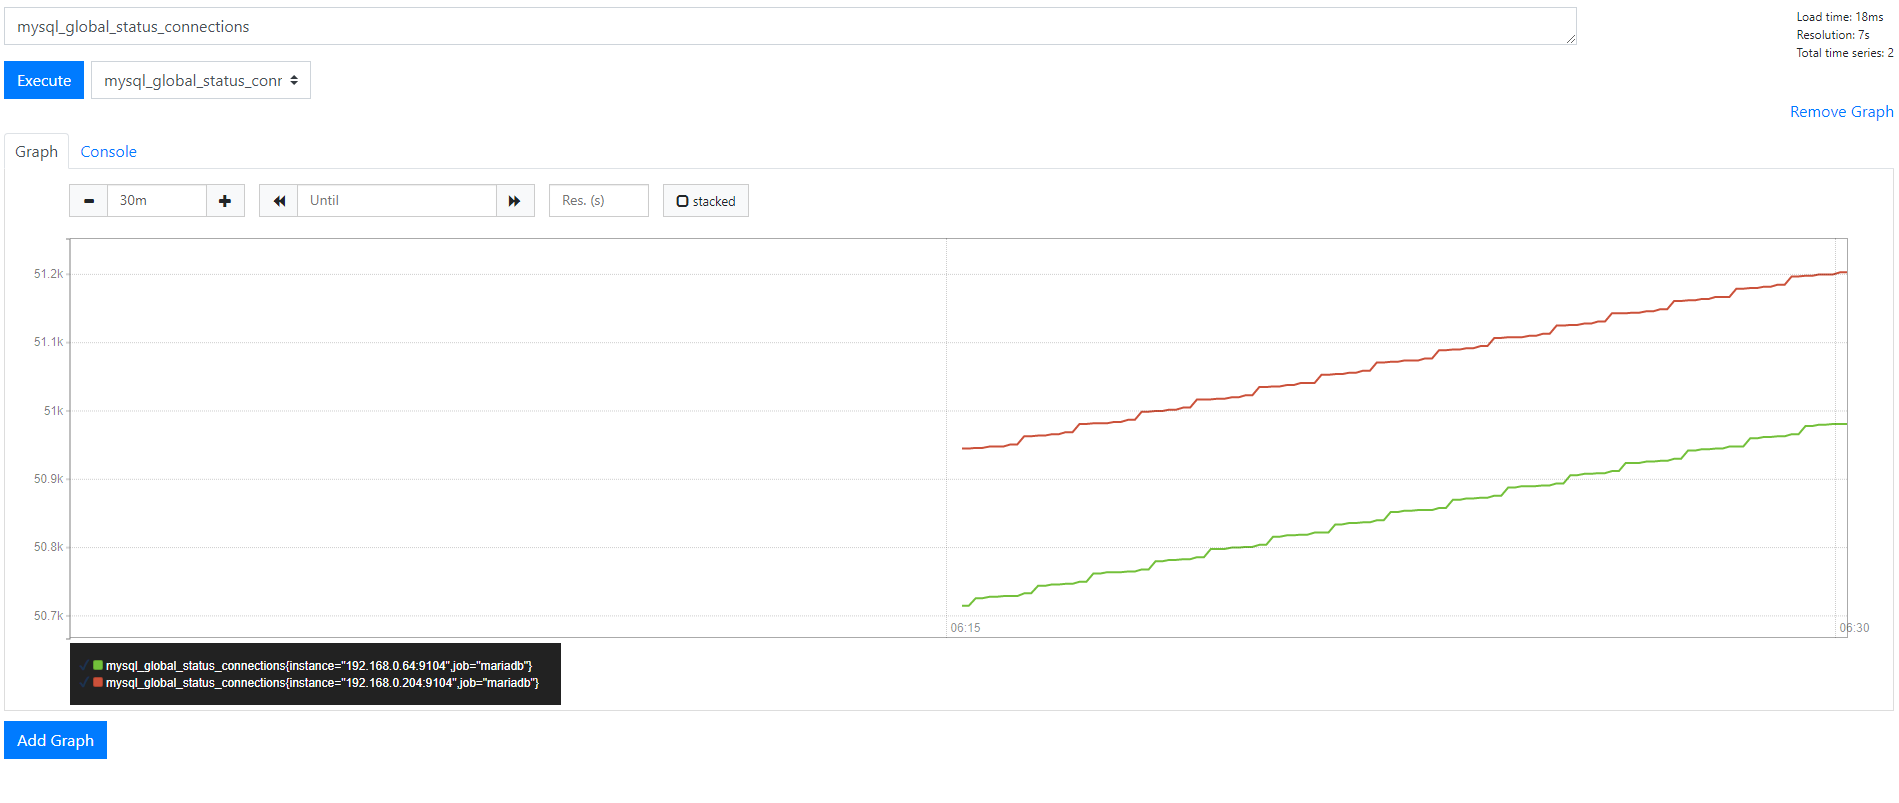
登陆Prometheus 页面:(注意其中的地址要替换为你环境的地址,另外如果要从公网的地址访问的话,注意配置好华为云的安全组规则,限制要登陆的地址范围。)
http://你的IP地址:9090
可以在Execute按钮旁边的下拉框里面看到很多指标,我们选择一个连接数的,调整一下监控时间,比如我们调整成过去30分钟,然后就可以看到如下图所示的监控图
总结
通过以上的测试我们可以发现,这几款常用的监控工具,都可以在arm64平台上运行良好,而且都可以监控MariaDB数据库,效果都不错。而且这几款工具还都是开源免费的,有兴趣的小伙伴可以探索一下更多的功能。
参考链接:
https://www.cnblogs.com/ivictor/p/5101506.html
https://www.jianshu.com/p/b8508fe10b8e
https://github.com/innotop/innotop
https://github.com/jzawodn/mytop
http://jeremy.zawodny.com/mysql/mytop/
https://www.zabbix.com/documentation/4.0/zh/manual/introduction
https://prometheus.io/docs/prometheus/latest/getting_started/