Author: zhaorenhai
This article attempts to explore some useful performance monitoring tools on the arm64 platform that can be used to monitor MariaDB databases.
The test platform still uses Huawei Cloud’s Kunpeng virtual machine, and the OS uses Ubuntu 18.04. A pair of MariaDB primary-replica databases have been deployed on other virtual machines in the same intranet in advance, and database user names and passwords for remote connections have been established. MariaDB uses the 10.1 version that comes with Ubuntu.
This article is going to test four free and open source tools including two command line tools, and two large graphical operation and maintenance tools.
The two command line tools are innotop and mytop.
Graphical operation and maintenance tools are Zabbix and Prometheus.
innotop
Innotop is a monitoring tool written in Perl. The source code is here https://github.com/innotop/innotop .
We directly download the latest code.
1 | git clone https://github.com/innotop/innotop |
Compile:
1 | cd innotop |
installation:
1 | sudo make install |
Run (-w parameter represents the persistence mode, the configuration will be persisted to the file):
1 | innotop -w |
Enter ? , you can see the instructions. As follows:
1 | Query List (? for help) Servers: server |
We enter an @ and press Enter to configure a database and to see the effect.
This is the first time running, there is no connection. You can input a name, name the new connection, and press Enter.
Then follow the prompts to enter the database address, port, configuration database address and port format as follows:
1 | DBI:mysql:;host=192.168.0.204;port=3306 |
Then press Enter, you will be prompted for your username, password, etc. The prompts are very friendly.
After configuration, it can be used normally.
We can enter uppercase A, B, Q, I and other commands to switch between different interfaces to see the database cache information, IO information, TPS and so on.
In order to display multiple databases on the same interface, we can enter @ to configure multiple database links.
Then enter a # to create a server group, enter multiple connection names that have been established, separated by spaces, and that’s it.
When we select a server group during operation, multiple servers can be displayed on the same interface.
For example, we configured a primary database and a replica database and placed them in the server group.
The following is the IO interface of the two databases displayed, the effect is still very good:
1 | InnoDB I/O Info (? for help) Servers: server |
This article is not an introduction document for innotop, just to test whether innotop can run normally on the arm64 platform, and whether it can monitor the MariaDB database normally. Therefore, the introduction of other usage and interface of inntop is no longer wordy. Interested friends can try it. There are also a lot of innotop information on the Internet. You can also see the instructions by using command man innotop .
mytop
mytop is also a small tool written in Perl, which is widely used. However, the disadvantage is that it can only connect to one database server, and it is relatively old, its functions are relatively simple, and the information obtained is relatively limited.
mytop can be installed directly from the apt command:
1 | sudo apt install mytop |
To configure, edit the following files:
1 | vi ~/.mytop |
Enter the following:
1 | user=proxysql |
Execute:
1 | mytop |
The interface is as follows:
1 | MySQL on 192.168.0.204 (10.1.47) load 0.00 0.00 0.00 1/1397 32133 up 16+23:58:33 [17:45:26] |
You can see that the style is similar to top, and the effect is pretty good.
For more information about mytop, please refer to the following link: http://jeremy.zawodny.com/mysql/mytop/ . There are also a lot of relevant information on the Internet, and you can also see relevant instructions with command man mytop.
Zabbix
Zabbix is a large-scale monitoring tool, not only used to monitor the database, but here we simply use it to monitor MariaDB.
Regarding the detailed introduction of its structure, functions, etc., the official website includes a lot of information on other websites, so I won’t go into details here. Here only describes the steps of testing on our test environment. (The specific installation steps may be different for different versions of Zabbix, and different OSs are also different. The Zabbix3.0 version that comes with Ubuntu 18.04 is installed here, for reference only)
Firstly we install Zabbix Server and Zabbix Frontend on the test virtual machine.
zabbix-server has two versions, PostgreSql and Mysql, according to the built-in database it uses. In order to distinguish it from the target database MariaDB we want to monitor, we install the PostgreSql version here.
1 | sudo apt install zabbix-server-pgsql zabbix-frontend-php php-pgsql |
Install Zabbix Agent on the master and slave database nodes we want to monitor
1 | sudo apt install zabbix-agent |
Zabbix Agent will start automatically after installation.
Zabbix Server needs to be configured to log in to the node where the Server is located
First create a database for Zabbix Server’s own use
1 | sudo -u postgres createuser --pwprompt zabbix |
Then import the data
1 | zcat /usr/share/zabbix-server-pgsql/schema.sql.gz |sudo -u zabbix psql zabbix |
Configure the relevant information of the self-use database just set up in the Zabbix Server configuration file
1 | vi /etc/zabbix/zabbix_server.conf |
Ensure that the following configuration items are configured correctly
1 | DBHost=localhost |
Start Zabbix Server
1 | service zabbix-server start |
Start configuring Frontend
1 | cd /etc/apache2/conf-enabled |
Configure the time zone parameters inside correctly, the default is as follows:
1 | # php_value date.timezone Europe/Riga |
We changed to the following settings:
1 | php_value date.timezone Asia/Shanghai |
After changing to the correct time zone, proceed as follows:
1 | service apache2 restart |
Then access the following link from the browser (note that the address should be replaced with the address of your environment, and if you want to access from the public network address, pay attention to configure the HUAWEI CLOUD security group rules to limit the address range to be logged in.)
http://ip address of the test machine/zabbix
Then click next and follow the prompts to configure step by step.
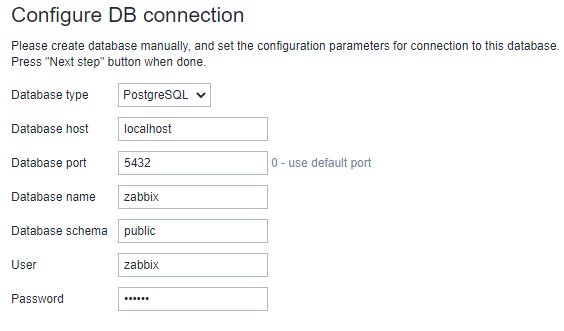
Configure the database connection as shown
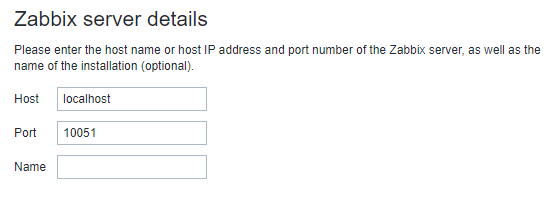
Where the server is configured, just use the default value
In the last step, you will be prompted to download a configuration file, download the configuration file and upload it to the /etc/zabbixdirectory.
Finally restart apache2
1 | service apache2 restart |
Then re-login to the http://ip address of the test machine/zabbix web page, enter the user name Admin, password zabbix, and you can see the Zabbix system page.
Then we create two Hosts, one is the MariaDB master database and the other is the MariaDB slave database.
Click Configuration, Hosts, Create host, where Host name, Groups and IP address are required.
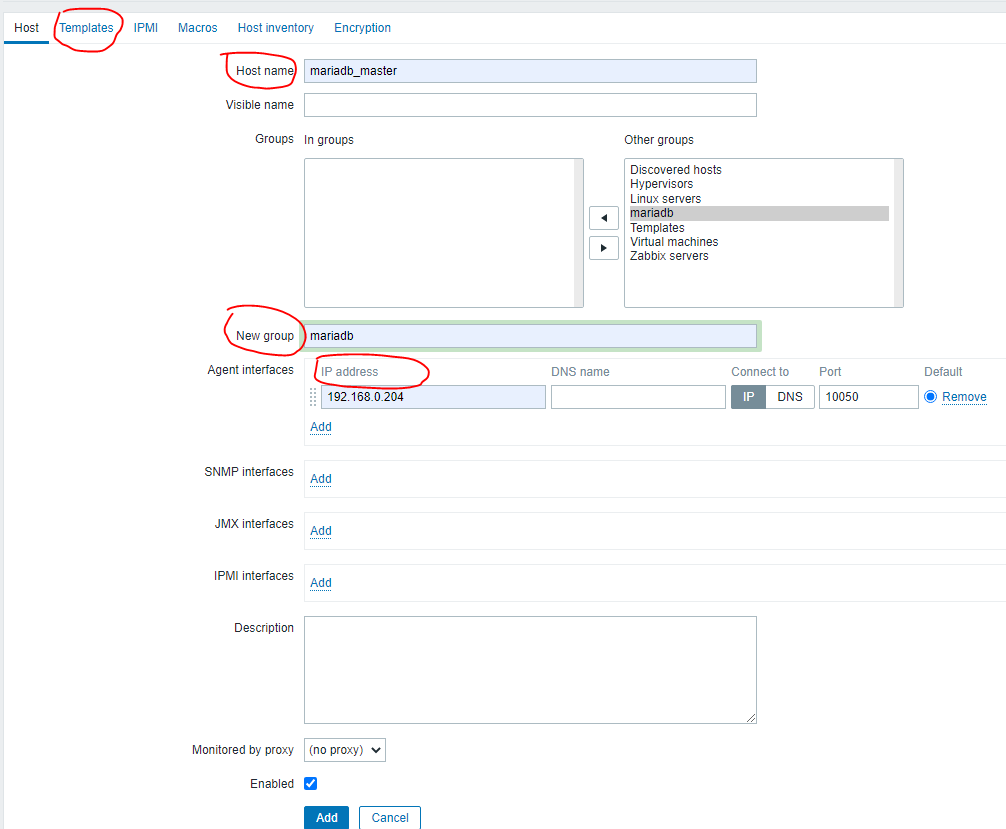
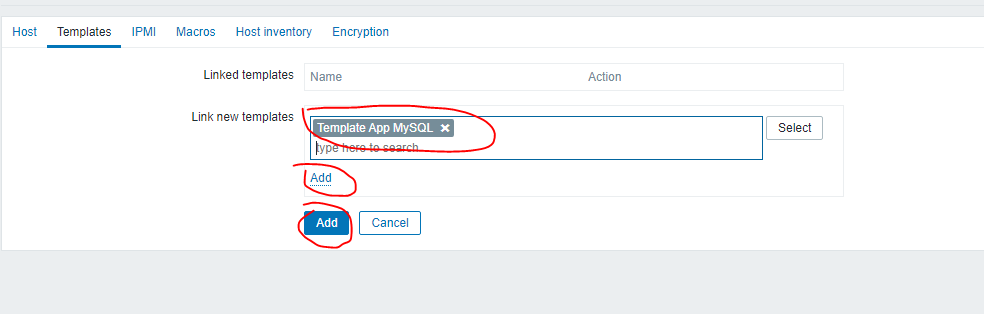
After the host is created, you can click the Templates button circled in the above figure, go to the following page, enter mysql to search for the template, and then click the add button to associate the mysql monitoring template to the host
The configuration of Frontend is complete.
Log in to the virtual machine where the two agents are located and do the following configuration
1 | cp /usr/share/doc/zabbix-agent/examples/userparameter_mysql.conf /etc/zabbix/zabbix_agentd.conf.d/ |
Edit configuration file
1 | vi /var/lib/zabbix/.my.cnf |
Enter the following:
1 | [mysql] |
Note that the entered user must be connected to MariaDB on this machine and have the relevant permissions to query.
Then edit the /etc/zabbix/zabbix_agentd.conffile to ensure that the configuration of the following three items is correct
1 | Server=192.168.0.54 |
Server and ServerActive are the IP addresses of Zabbix Server. And Hostname is the name of the Agent host name which you configured on Frontend, this configuration of each Agent is different.
Then restart the agent
1 | service zabbix-agent restart |
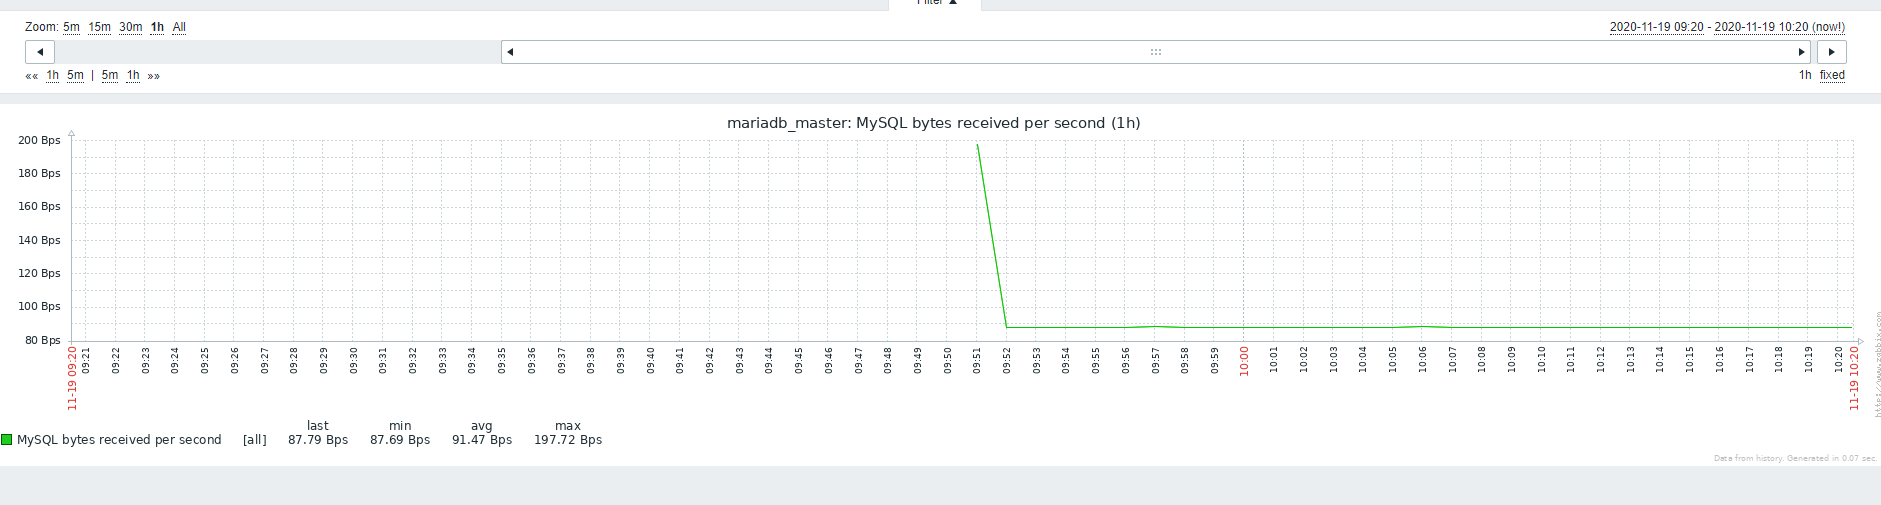
Now log in to the front end again, and you can see the monitoring effect.
Click Monitoring, Latest Data, you can see many monitoring items, bandwidth, slow query, select, insert, delete request qps and so on.
Let’s look at a bandwidth monitoring chart, the effect is as follows:
If you feel that the default Mysql template function is not perfect enough, interested friends can customize the template by themselves, or download the customized template from the Percona website and import it. I won’t go into details here
Prometheus
Prometheus is also a large-scale monitoring tool. This time we will only briefly test its database monitoring function. I will not say more about its architecture, functions and other aspects.
Let’s first install Prometheus Server.
We download the latest arm64 version of Prometheus from the official website to install it.
1 | wget https://github.com/prometheus/prometheus/releases/download/v2.22.2/prometheus-2.22.2.linux-arm64.tar.gz |
Download the latest mysqld_exporter on the master and slave database nodes to install
1 | wget https://github.com/prometheus/mysqld_exporter/releases/download/v0.12.1/mysqld_exporter-0.12.1.linux-arm64.tar.gz |
Edit the file vi prometheus.ymland add the following configuration. The IP address inside is the IP of the master-slave database node, and the port is the port equivalent to the client process that we will install on the master-slave database node later. Let’s configure it first.
1 | - job_name: 'mariadb' |
Start Prometheus
1 | ./prometheus --config.file = prometheus.yml |
Edit the following files on the master and slave database nodes
1 | vi .my.cnf |
Enter the following content, pay attention to ensure that the entered user has the permission to connect to MariaDB locally and has the permission to query:
1 | [client] |
Start mysqld_exporter
1 | nohup ./mysqld_exporter --config.my-cnf=./.my.cnf & |
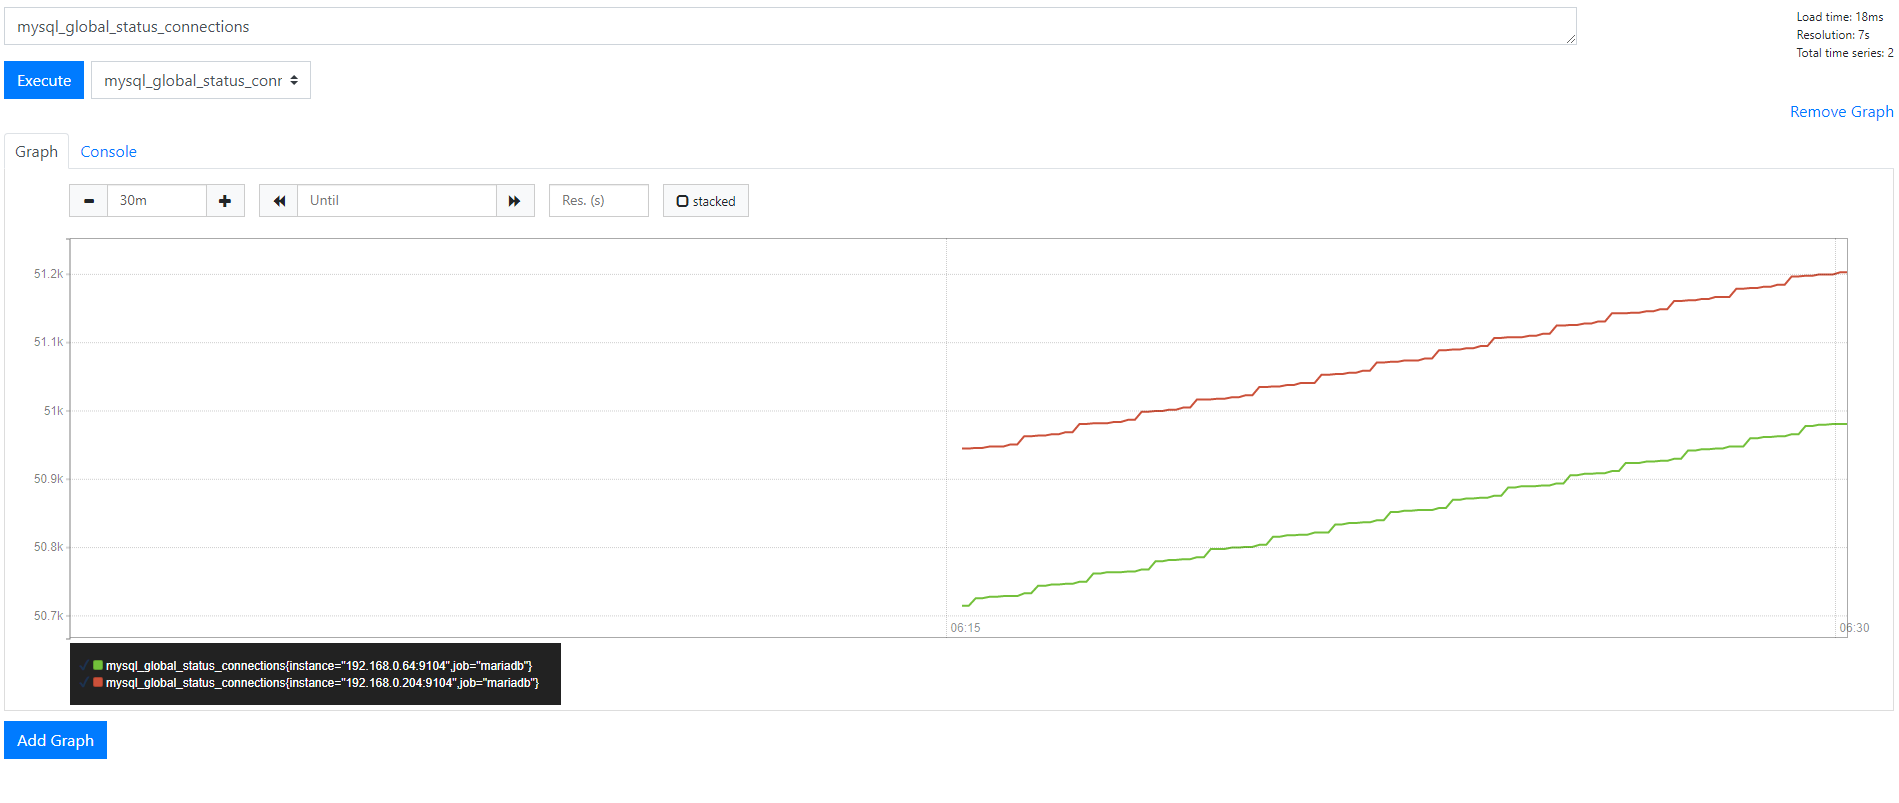
Log in to the Prometheus page: (Note that the address should be replaced with the address of your environment. In addition, if you want to access from the public network address, pay attention to configuring the HUAWEI CLOUD security group rules to limit the address range to be logged in.)
[http://your IP address:9090](http://your IP address:9090)
You can see many indicators in the drop-down box next to the Execute button. We select a number of connections and adjust the monitoring time. For example, if we adjust it to the past 30 minutes, then we can see the monitoring chart as shown in the following figure.
Summary
Through the above tests, we can find that these commonly used monitoring tools can all run well on the arm64 platform, and can monitor MariaDB databases with good results. And these tools are open source and free, interested friends can explore more functions.
Reference link:
https://www.cnblogs.com/ivictor/p/5101506.html
https://www.jianshu.com/p/b8508fe10b8e
https://github.com/innotop/innotop
https://github.com/jzawodn/mytop
http://jeremy.zawodny.com/mysql/mytop/
https://www.zabbix.com/documentation/4.0/zh/manual/introduction
https://prometheus.io/docs/prometheus/latest/getting_started/